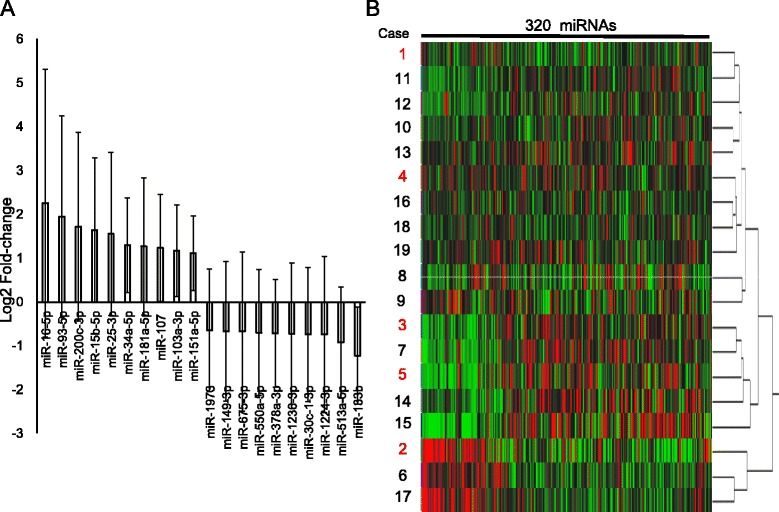
Fig. 1.

Expression of miRNAs in ESCC. a Twenty miRNAs that were expressed in ESCC tumors with more than a twofold difference compared with corresponding normal counter parts. b Cluster analysis. The diagram shows the results of the hierarchical clustering of miRNAs and 19 samples. Columns: 320 miRNAs that were detected in all 19 cases. Red represents a higher expression level; green represents a lower expression level. Rows: samples. Cases 1–5 (highlighted in red) were non-relapse cases. Cases 6–19 were relapse cases
