
Fig. 2.
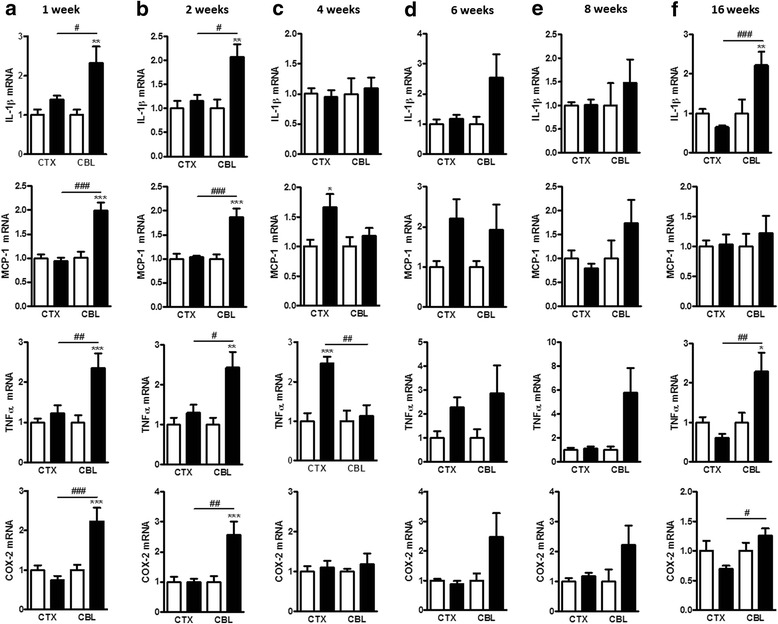
Central inflammatory tone induced by a HFD at different time-points. mRNA expression of inflammatory markers at the different time-points in the cerebellum (CBL) and in the cortex (CTX) at a 1 week, b 2 weeks, c 4 weeks, d 6 weeks, e 8 weeks, and f 16 weeks. Data are mean ± s.e.m. The standard diet groups were set at 1. The white columns represent mice fed a standard diet and the black columns represent the mice fed a HFD. One-way ANOVA with Bonferroni’s post test or Kruskal-Wallis test with Dunn’s post test between HFD group and its respective CTL group (*P < 0.05; **P < 0.01; and ***P < 0.001) and between CNS regions (#P < 0.05; ##P < 0.01; and ###P < 0.001)