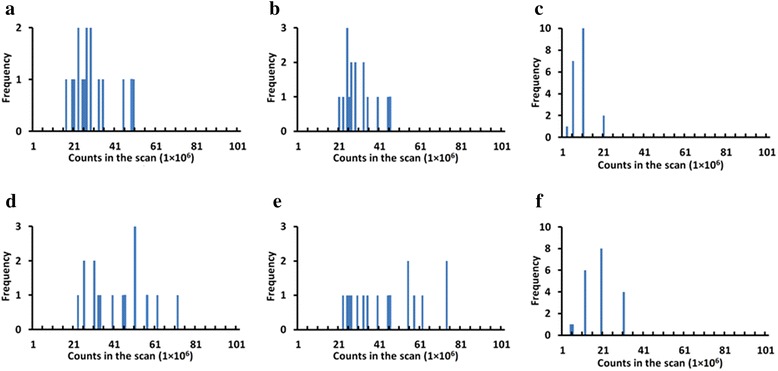
Fig. 6.

Frequency of cases with COV over 10 % based on SUVmean vs. counts in the scan, in different regions: (a) background liver, (b) background lung, (c) TB lesion and based on SUVmax vs. counts in the scan, in different regions: (d) background liver, (e) background lung, (f) TB lesion. Histogram bin size is 1 × 10⁶
