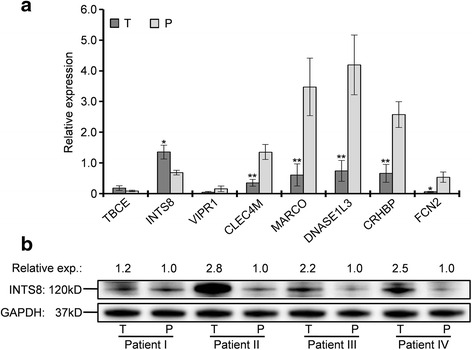
Fig. 2.

Measurement of gene expression at mRNA and protein level. a mRNA expression of genes in 11 tissues of HCC patients compared with matched paracancerous tissue. * P < 0.05; ** P < 0.01. b Protein expression of INTS8 in four tissues of HCC patients compared with expression in corresponding paracancerous tissues. The intensity of protein bands was measured by Image J software.. T, HCC tissue; P, paracancerous tissue
