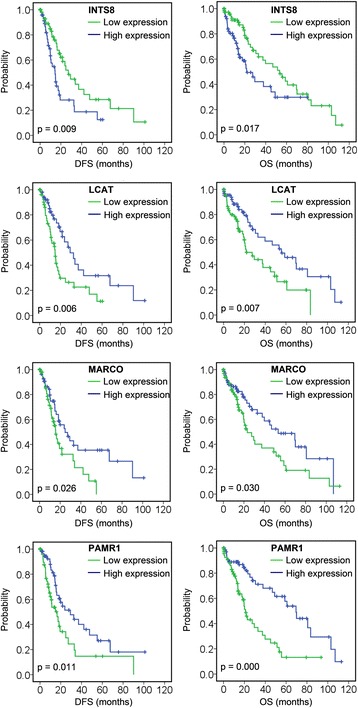
Fig. 4.

Association of INTS8, LCAT, MARCO, and PAMR1 with DFS and OS, analysed using Kaplan-Meier survival plots. The survival data of 157 HCC patients in a TCGA cohort were used for the analysis. Expression values of a gene were dichotomised into high expression (blue line) and low expression (green line) using the median as a cutoff
