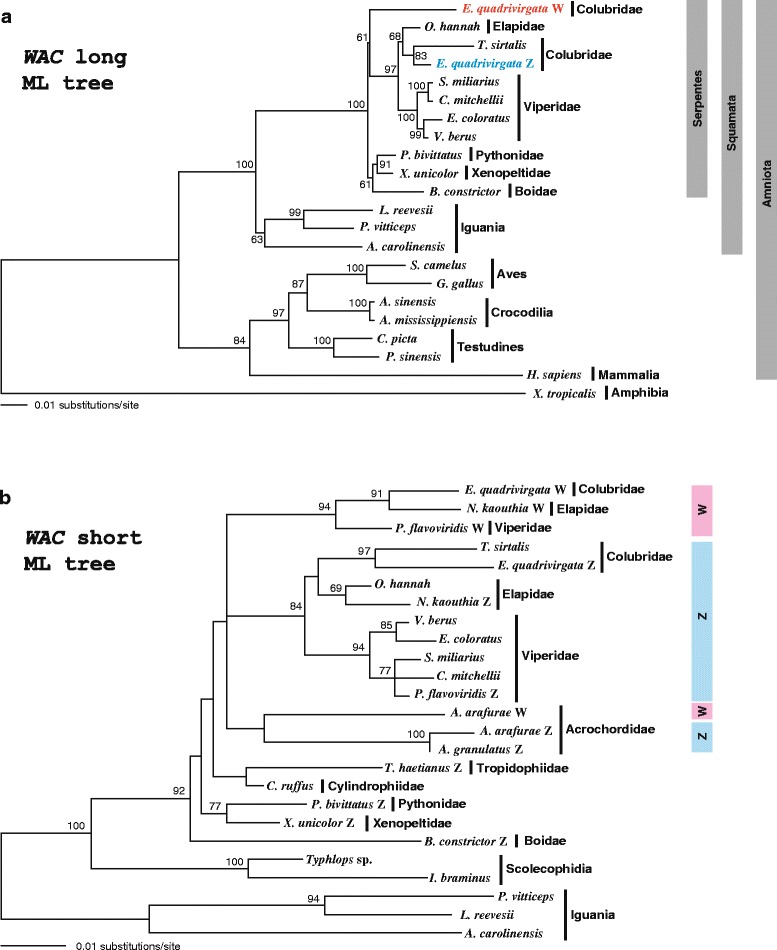
Fig. 4.

Molecular phylogenetic trees of WAC genes. Maximum-likelihood trees of WAC genes were constructed with the long alignment for 21 tetrapod species (a) and the short alignment for 21 squamate species (b). Bootstrap values (> 50 %) are shown on each node. Classification is shown on the right side of species. Blue and pink bars in b show clades of Z and W homologs of caenophidian species, respectively
