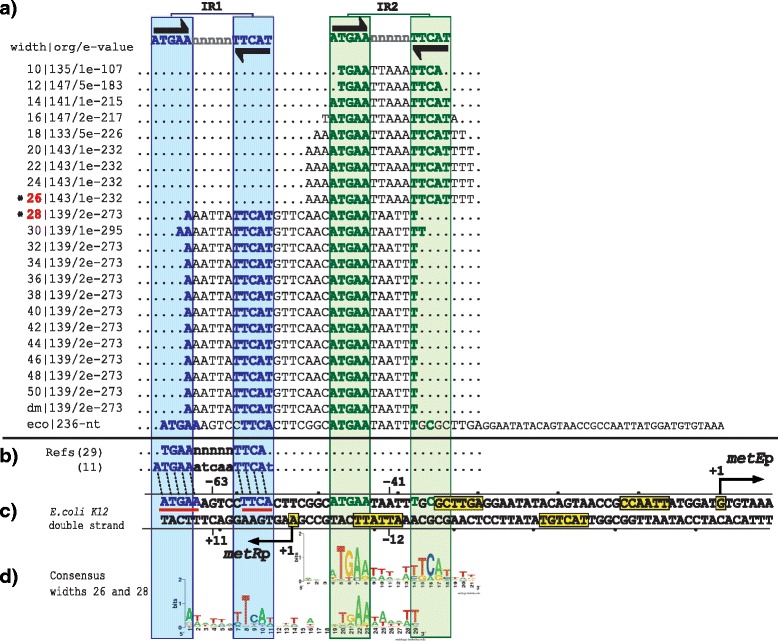
Fig. 3.

PProCoM analysis of the metR-metE intergenic regions in Gammaproteobacteria. The descriptions of sections (a to d) and the symbols are the same as those of Fig. 2. d None of the motifs obtained using the different analysis window sizes include all IR sequences of the intergenic metR-metE region; therefore, the LOGOs of two different window sizes are included
