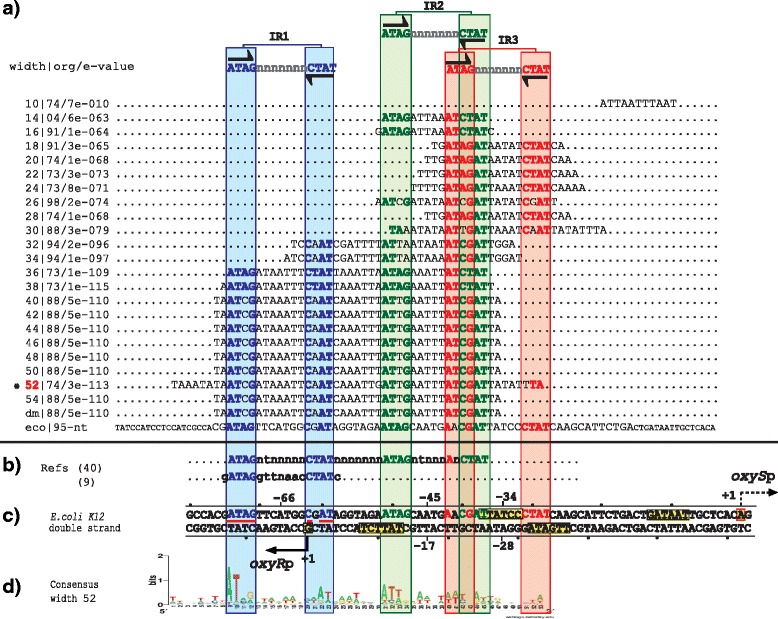
Fig. 4.

PProCoM analysis of the oxyR-oxyS intergenic regions in Gammaproteobacteria. The descriptions of sections (a to d) and the symbols are the same as those of Fig. 2

PProCoM analysis of the oxyR-oxyS intergenic regions in Gammaproteobacteria. The descriptions of sections (a to d) and the symbols are the same as those of Fig. 2