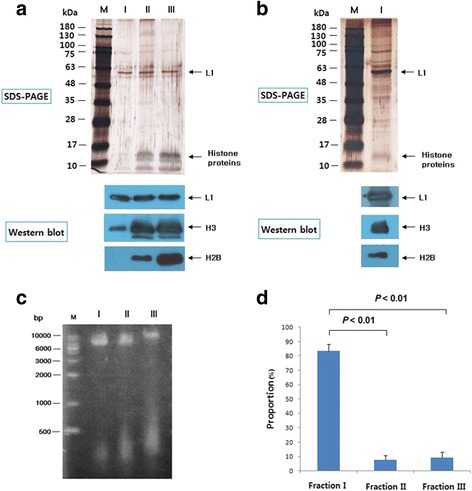
Fig. 2.

Analysis of histones, cellular DNA contents and proportions of HPV16 PsVs from fraction I, II and III. a shows SDS-PAGE and Western blots comparing the L1, histone H3 and histone H2B contents of the three types of PsVs. b shows SDS-PAGE and Western blots for detecting L1, histone H3 and histone H2B in type I PsVs. b is a repeat of panel A but with extended film exposure for Western blots. c is a result of agarose gel showing cellular DNA contents of PsVs from fraction I, II and III. d is result showing the proportions of PsVs from fraction I, II and III. To calculate the proportion of each type, their L1 content was determined by sandwich ELISA. Data represent the mean ± SD of four independent experiments
