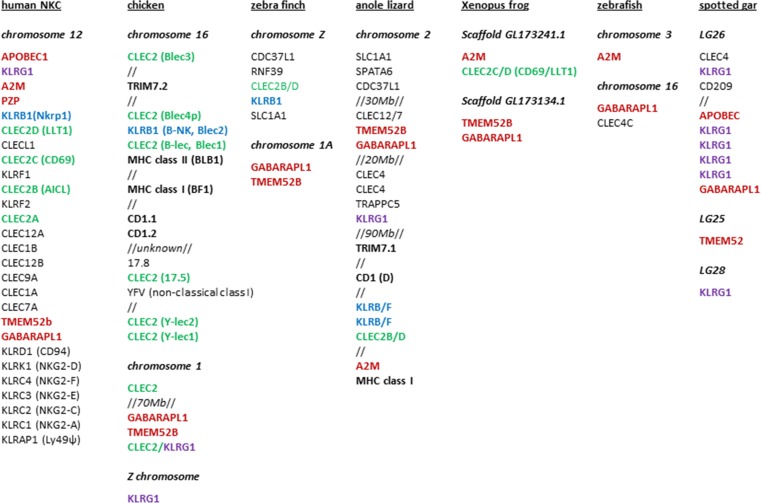
Fig. 5.
The relative positions of CLEC2 and KLRB genes on chromosomes (or linkage groups, LG) in different species are shown in comparison to other genes. Genes were identified (S. Rogers, unpublished) using the ENSEMBL genome browser (www.ensembl.org), and most likely orthology of the gene confirmed by blasting back against the NCBI database (www.ncbi.nlm.nih.gov). In some species, the marker gene could not be identified or located and therefore it is not shown. All potential CLEC2 (green bold) and KLRB (blue bold) genes, as well as selected KLRG (purple bold), NKC (red bold) and MHC (black bold) genes identified in the various species are shown. Where other genes are inserted is indicated by double forward slash (//), with the distance shown if significant (Mb megabases) (colour figure online)

