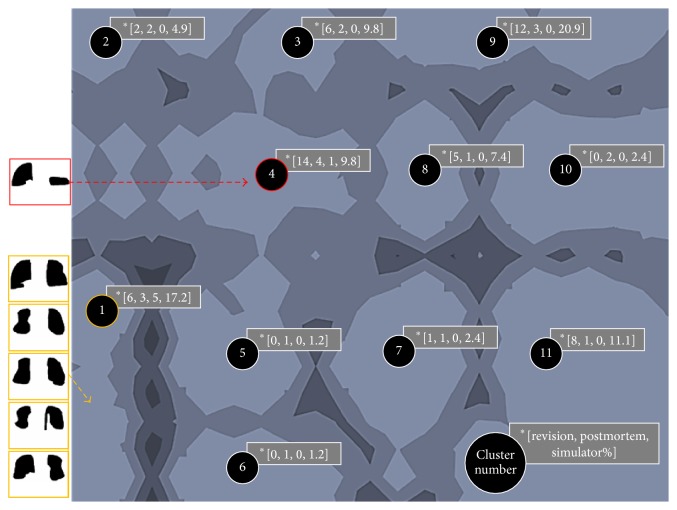
Figure 3.
U-matrix visualization of the SOFM after training. Eleven wear pattern clusters were identified. Five out of six in vitro tested components were assigned to cluster “1”. ∗The number of revised (R), postmortem (P), and simulator (S) components and the total percentage (%) of components assigned to each group are noted in brackets [R, P, S, %]. Light map colors represent cluster areas (valleys), while darker colors represent cluster boundaries (hills).

