Figure 2.

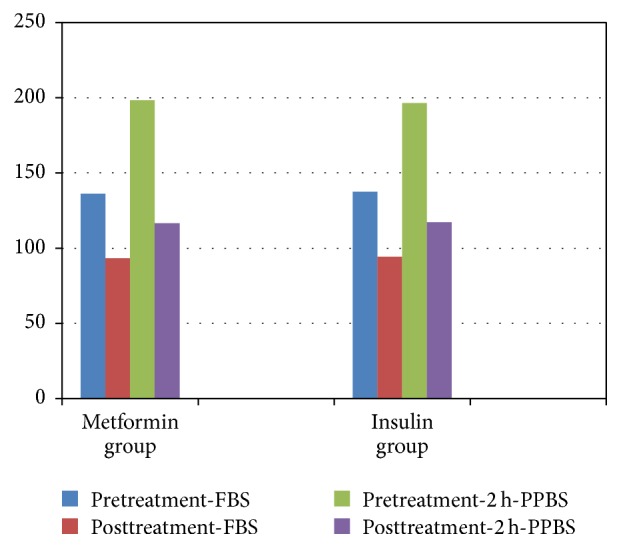
The figure shows pattern of blood sugar in both groups before and after treatment (fasting blood sugar (FBS) and 2 h postprandial blood sugar (2 h PPBS)).

The figure shows pattern of blood sugar in both groups before and after treatment (fasting blood sugar (FBS) and 2 h postprandial blood sugar (2 h PPBS)).