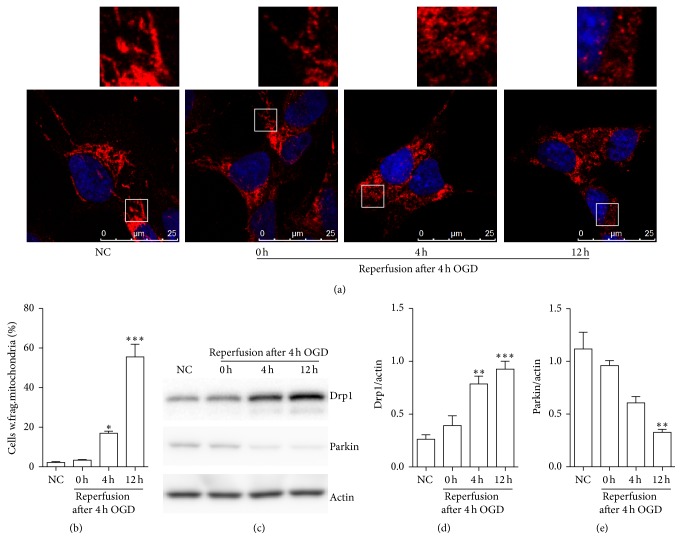
Figure 1.
OGDR affects mitochondrial morphology and the protein levels of Drp1 and parkin. (a) Mitochondrial morphology was analyzed with Tom20 staining by confocal microscopy in N2a cells. The confocal images and the enlarged section of the confocal images are displayed. (b) The average percentage of N2a cells with fragmented mitochondria was measured. (c) Western blot analysis and (d, e) quantitative analysis of Drp1 and parkin expressions in N2a cells upon OGDR insult. Actin was used as a loading control. Data are presented as the mean ± SEM. Asterisks indicate statistically significant difference compared with the control; ∗ p < 0.05, ∗∗ p < 0.01, and ∗∗∗ p < 0.001.

