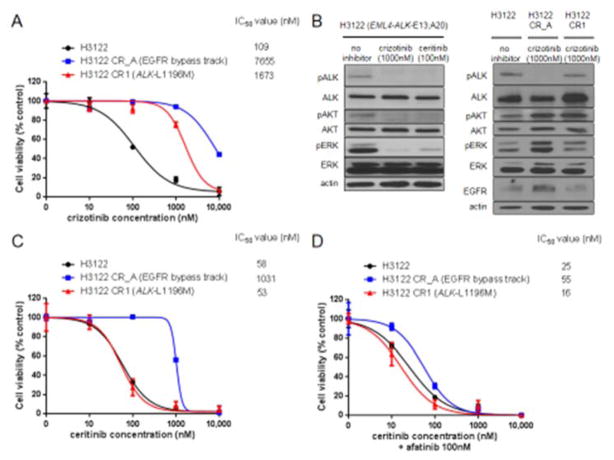
Figure 1. Preclinical models of acquired resistance to crizotinib in ALK rearranged lung cancers.
A. Dose-inhibition curves for crizotinib using H3122, H3122 CR_A and H3122 CR1, with 50% inhibitory concentration (IC50) using nanomolar (nM) concentrations indicated. B. Western blot results showing the intracellular signaling effects of crizotinib 1000nM and certinib 100nM after 6 hours of exposure to H3122 cells, with inhibition of phosphorylated (p) levels of each protein indicating drug activity. The same intracellular signaling is shown for H3122 CR_A and H3122 CR1 cells grown in the presence of continuous 1000nM of crizotinib. C. Dose-inhibition curves for ceritinib using H3122, H3122 CR_A and H3122 CR1, with IC50 concentrations indicated. D. Dose-inhibition curves for ceritinib in the presence of afatinib 100nM using H3122, H3122 CR_A and H3122 CR1, with IC50 concentrations indicated.

