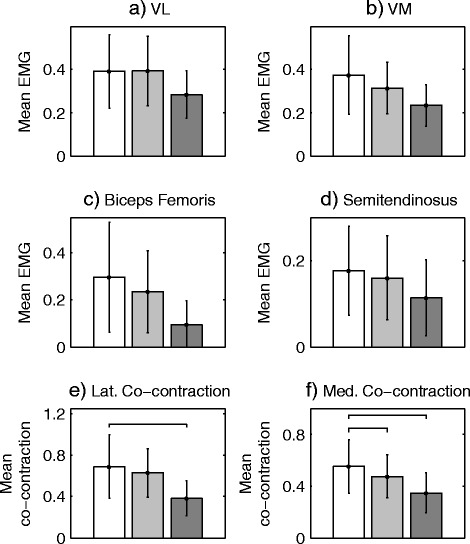
Fig. 2.

Mean normalised muscle activation during early the stance phase (15-25 %) for (a) vastus lateralis (VL), (b) vastus medialis (VM), (c) biceps femoris and (d) semitendinosus. Healthy participant data is shown in dark grey, baseline knee OA data in white and post-AT knee OA data in light grey. Plots (e) and (f) show lateral/medial co-contraction, calculated as the sum of hamstring and quadriceps activity and horizontal bars denotes significant differences (p < 0.01). Note that statistical testing was only performed on the measures of co-contraction
