Fig. 4.

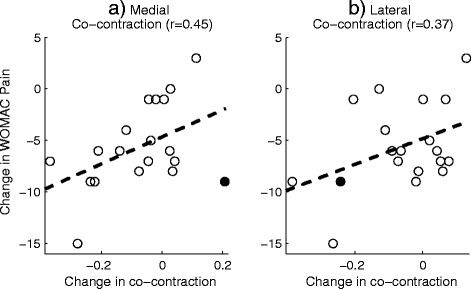
The relationship between the change in WOMAC pain (following the intervention) and the change in a) lateral and b) medial co-contraction during the pre-contact phase. The filled circle shows the outlying data point

The relationship between the change in WOMAC pain (following the intervention) and the change in a) lateral and b) medial co-contraction during the pre-contact phase. The filled circle shows the outlying data point