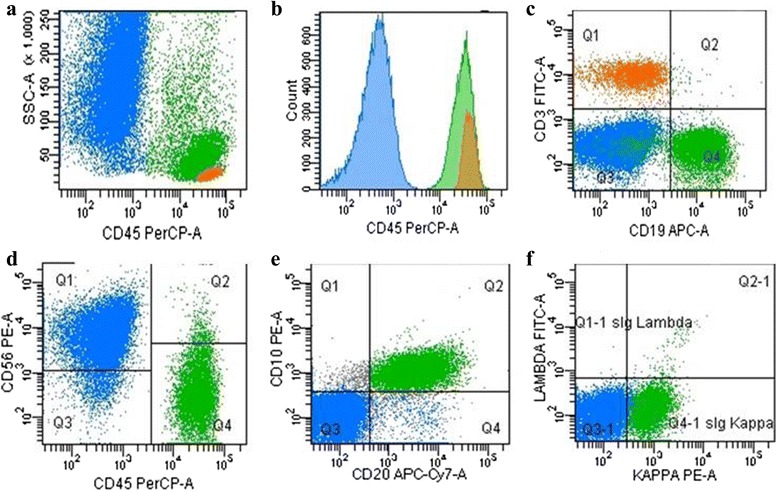
Fig. 2.

Flow cytometry analysis of cell suspension from one brain stereotactic needle biopsy of PCNSL. Blue color has been utilized to mark CD56 positive/CD45 negative brain cells (a, b, d), green for CD10 CD19 CD20 sIg-Kappa light chain positive large lymphoma cells (c, e, f), orange for the side population of CD3 positive T lymphocytes (a, b, c)
