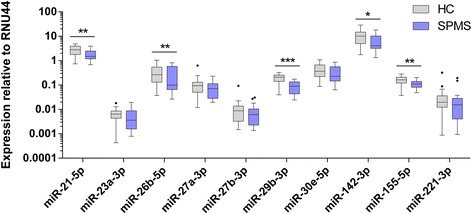
Fig. 2.

Tukey boxplot of top ten miRNAs expression (relative to RNU44) using RT-qPCR. Significant down-regulation of miR-21-5p, miR-26b-3p, miR-29b-3p, miR-142-3p, and miR-155-5p in SPMS was confirmed. Whiskers represent data within 1.5 interquartile range (IQR) of the upper and lower quartile. Data points outside of the 1.5 IQR are represented by black dots. p < 0.05, **p < 0.01, ***p < 0.001
