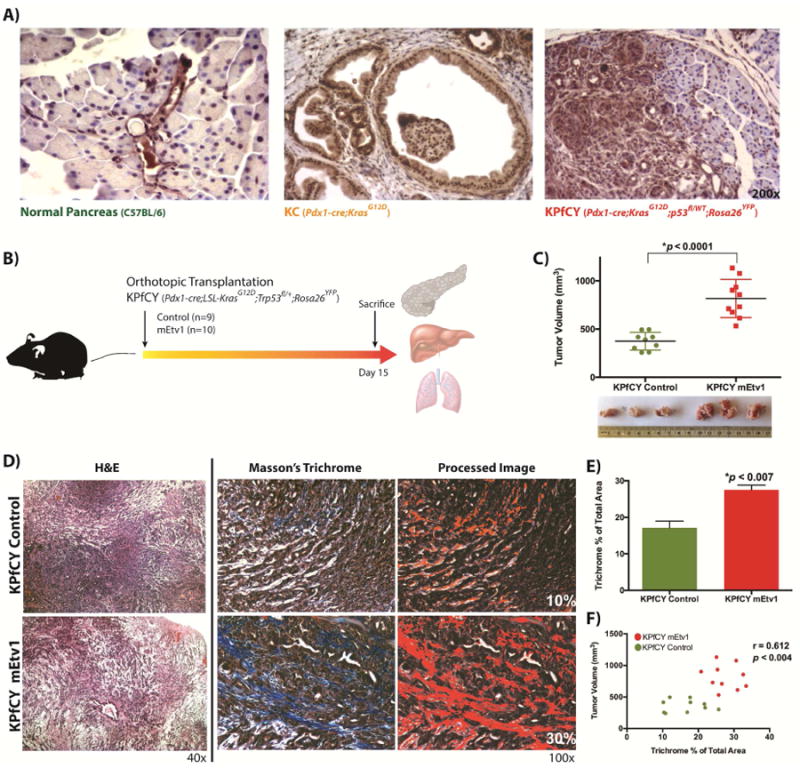
Figure 1. Overexpression of Etv1 in KPfCY-cells significantly expands the desmoplastic stroma.

(A) Etv1 immunohistochemistry in mouse sections with the indicated genotypes. Expression of Etv1 is restricted to the ductal compartment in the normal pancreas. Pancreatic Intraepithelial Neoplasia (PanIN) lesions display elevated levels of Etv1, while Etv1 is diffusely expressed in Pancreatic Ductal Adenocarcinoma (PDAC). (B) Schematic experimental design of orthotopic xenograft transplantation experiments with KPfCY and KPfCY mEtv1 cells. (C) Primary tumor volumes of KPfCY control and KPfCY mEtv1-overexpressiong orthotopic xenograft tumors. Etv1 overexpressing KPfCY cells form significantly larger primary tumors. (D) Hematoxylin/Eosin and Masson's trichrome staining of KPfCY Control (upper row) and KPfCY mEtv1 (lower row) orthotopic xenograft tumors. Image processing to perform semi-quantitation on trichrome staining is depicted adjacent. (E) Etv1 overexpressing orthotopic xenograft tumors display a significant increase in tumor stroma as measured by trichrome staining compared to control animals. (F) Correlation of tumor volume and trichrome positive area between KPfCY control (green dots) and KPfCY mEtv1 (red dots). The percentage of the trichrome positive area measured in (E) correlates significantly to the increase in tumor volume measured in (C).
