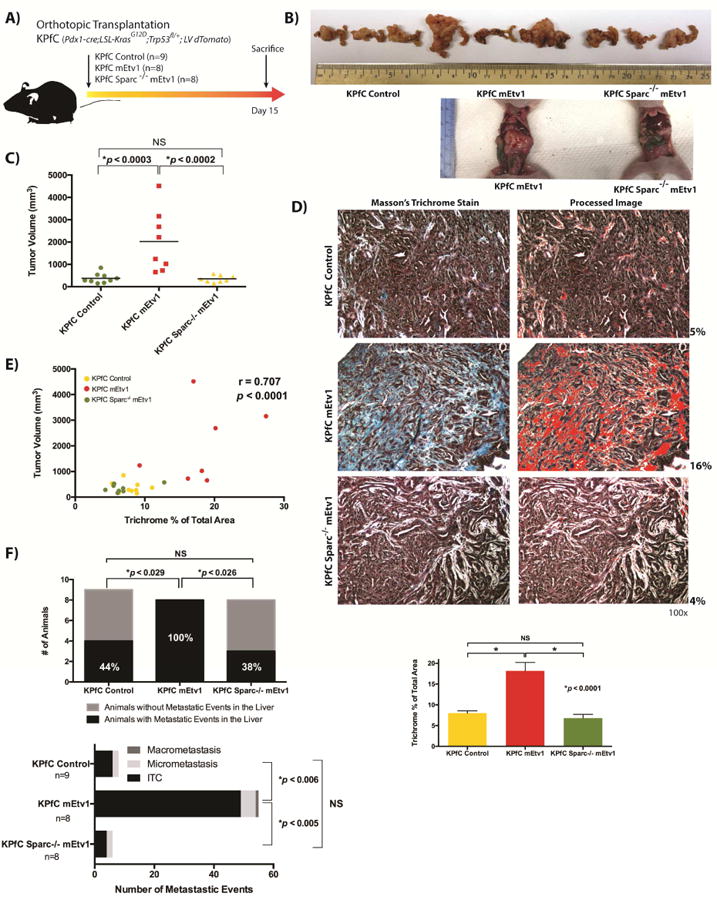
Figure 4. Loss of Sparc abrogates the increased expansion of stroma and development of metastasis mediated by Etv1.

(A) Schematic representation of independent orthotopic pancreatic xenograft transplantation experiments of KPfC Control, KPfC mEtv1, and KPfC Sparc-/- mEtv1 cells. All cells were lentivirally transduced with dTomato to allow for lineage labeling. (B) Representative pancreata of KPfC control, KPfC mEtv1 and KPfC Sparc-/- mEtv1 xenografts. Examples of large tumors in KPfC mEtv1 animals in comparison to KPfC Sparc-/- mEtv1 in situ in the abdomen of sacrificed mice are noted below. (C) Overexpression of Etv1 is associated with significant increase in tumor volume in comparison to KPfC control. However, the loss of Sparc completely abrogates the increase in tumor volume observed with mEtv1 overexpression. (D) Masson's trichrome staining of KPfC Control, KPfC mEtv1, and KPfC Sparc-/- mEtv1 tumors. Representative images are shown and semi-quantitative image processing was used as demonstrated adjacent. The increase in trichrome positive tumor stroma observed with Etv1 overexpression is abrogated by the loss of Sparc in KPfC Sparc-/- mEtv1 xenografts. (E) Correlation of tumor volume and trichrome positive area between KPfC Control (yellow dots), KPfC mEtv1 (red dots), and KPfC Sparc-/- mEtv1 (green dots) tumors. The percentage of the trichrome positive area measured in (D) correlates significantly to the increase in tumor volume measured in (C). (F) The overexpression of Etv1 is associated with the development of significantly more liver metastasis in comparison to KPfC Control. However, the loss of Sparc completely abrogates this Etv1 associated increase in metastasis development.
