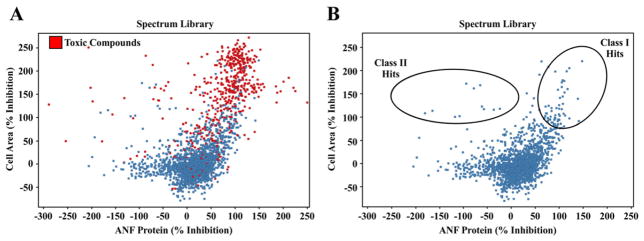
Fig. 3.
Graphical representation of hit compounds that block cardiomyocyte hypertrophy. (A) Compounds from the Spectrum Library are depicted based on percent inhibition of ANF expression (X-axis) and cell area (Y-axis) relative to the positive control HDAC inhibitor, TSA; % inhibition by TSA was set to 100% for each plate. Reduction in the number of identified cells (nuclei) compared to the positive control TSA was used as an indicator of toxicity. Toxic compounds are indicated in red, and were removed from subsequent analysis. (B) Class I hits are those compounds that significantly reduce cell area and ANF expression. Class II hits are compounds that significantly reduce cell area, but increase ANF expression.

