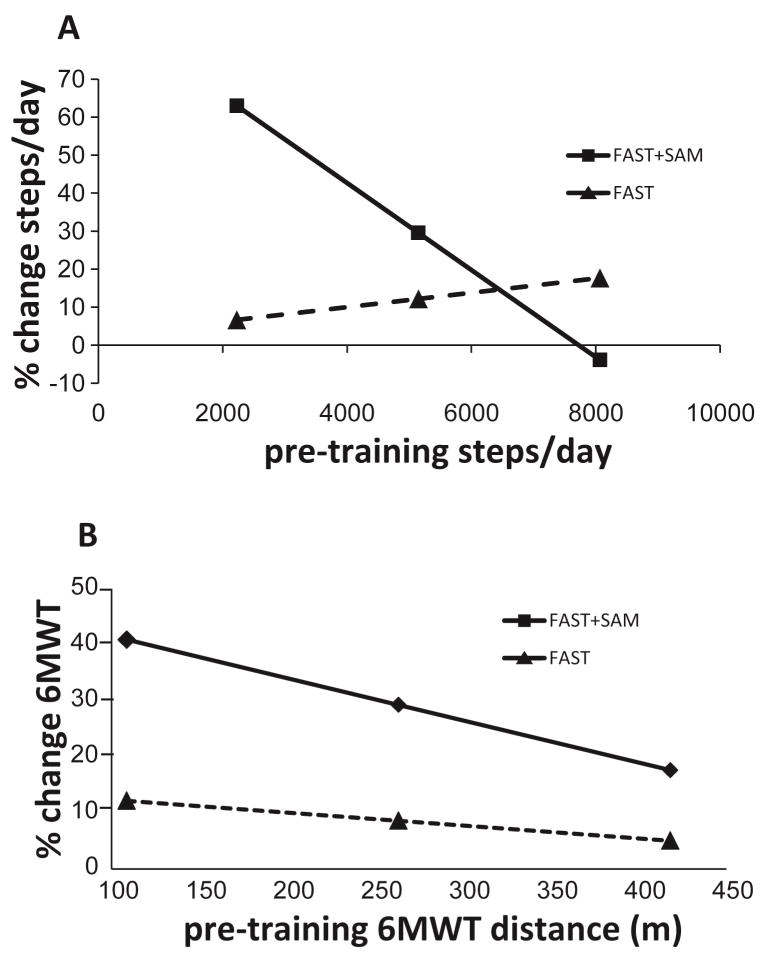
Figure 1.
Results of the moderated regression analysis for (A) Steps/day and (B) 6MWT. Solid lines represent data from the FAST+SAM group and dotted lines represent data from the FAST group. Each symbol represents the mean (middle symbol) ± 1 standard deviation (first and third symbol) of the group data presented on the x-axis (baseline steps day in (A), and baseline 6MWT distance in (B)).

