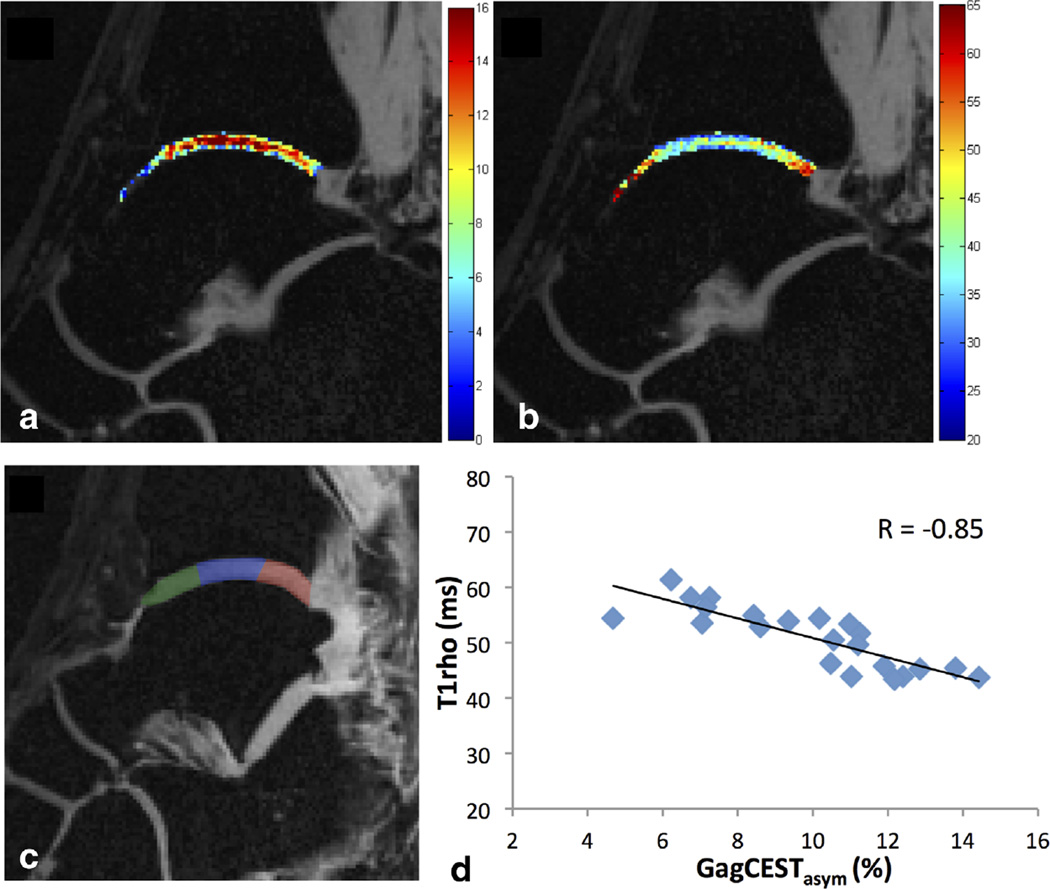
FIG. 5.
GagCESTasym maps (a) and T1ρ maps (b) of cartilage between the tibia and the talus in the ankle joint of a healthy volunteer. The cartilage was manually segmented into anterior (green), medial (blue), and posterior (red) segments (c), and the average GagCESTasym is plotted as a function of T1ρ relaxation time for each segment across eight slices (d). For this healthy volunteer, a Pearson correlation coefficient of −0.85 was observed between GagCESTasym and T1ρ relaxation time.

