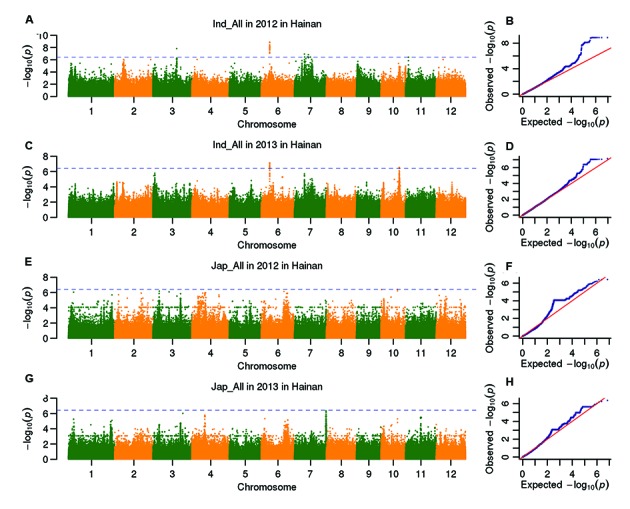
FIGURE 3.

Genome-wide P-values (A,C,E,G) and QQ plots (B,D,F,H) from the LMM model for heading date in indica and japonica in Hainan are demonstrated in the four panels. The horizontal dashed line (A,C,E,G) indicates the genome-wide significance threshold (P = 3.8 × 10⁷).
