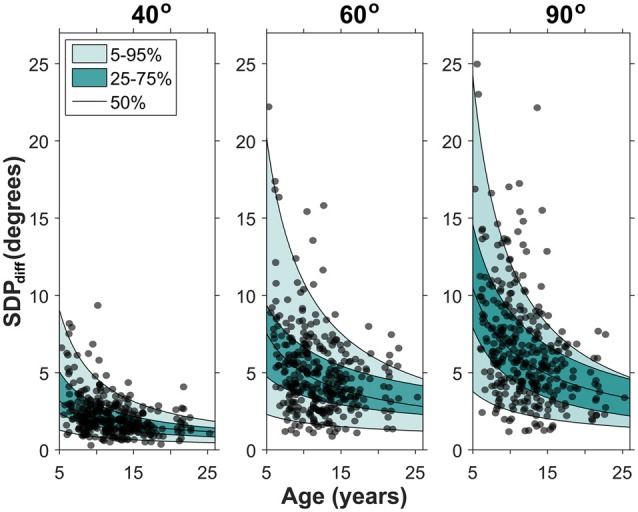
Figure 3.

Developmental changes in precision for each target position. Each data point represents a participant’s SDPdiff. The quantile regression estimates for the 5th, 25th, 50th, 75th and 95th percentile are shown. Note that SDPdiff decreased with age, indicating an age-related improvement in precision. The median fit for each target position is: SDPdiff,40 = 8.43 *age−0.61, SDPdiff,60 = 19.83 *age−0.60, SDPdiff,90 = 32.18 *age−0.70.
