
Figure 1.
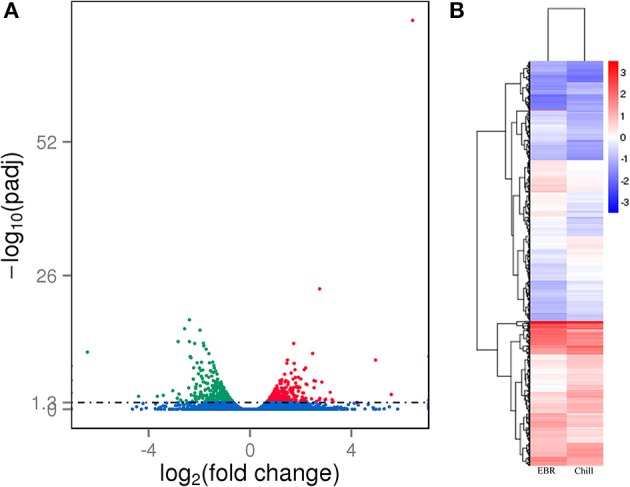
Transcriptome analysis of differentially expressed genes in Chill and Chill+EBR treatment of pepper leaves. (A) Volcano plot showed the DEGs between two different libraries. The q < 0.05 was used as thresholds to determine the significance of DEGs. Red dots represent up-regulated genes, green dots show down-regulated genes, and blue dots indicate transcripts that did not change significantly in the Chill+EBR library compared Chill. (B) Hierarchical clustering of all the DEGs based on log10 RPKM values. The color (from blue to red) represents gene expression intensity from low to high. Chill and Chill+EBR represent two treatments under alone chilling stress and chilling stress with 0.1 μM EBR.