
FIGURE 3.
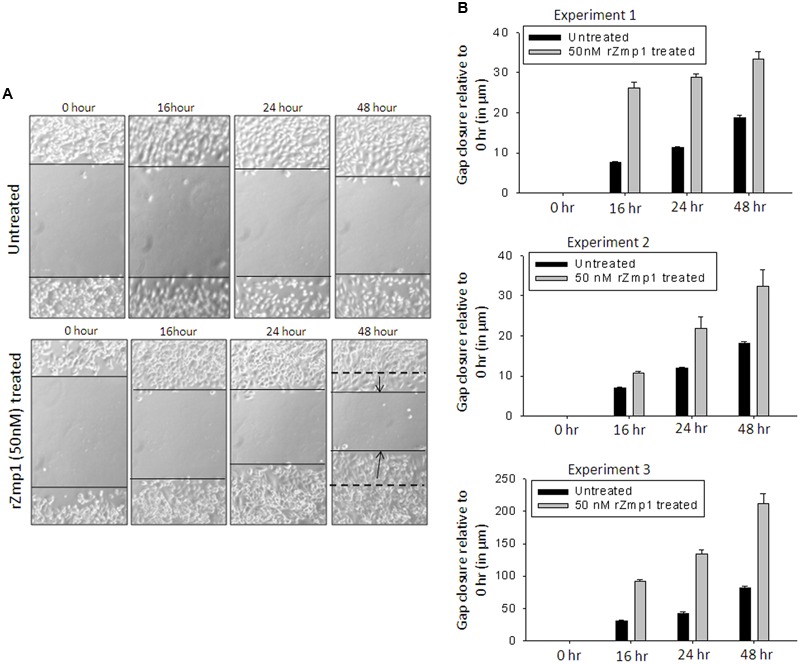
rZmp1 treatment helped CHO cell migration as observed by Gap closure assay. (A) Representative microscopic image from experiment 1 showing CHO cell migration as function of time upon 50 nM rZmp1 exogenous treatment. Monolayer of CHO cells were grown in 35 mm cell culture dish. A gap was introduced using a sharp tip and the cells were either only buffer treated (Upper panel) or 50 nM rZmp1 treated (lower panel). The extent of gap closure was monitored microscopically at regular intervals (0, 16, 24, and 48 h). (B) Bar graphs represents the distance of gap closure in μm (micrometers) relative to 0 h calculated using ImageJ software at regular intervals from three independent experiments. The error bars represent the standard deviation from mean.