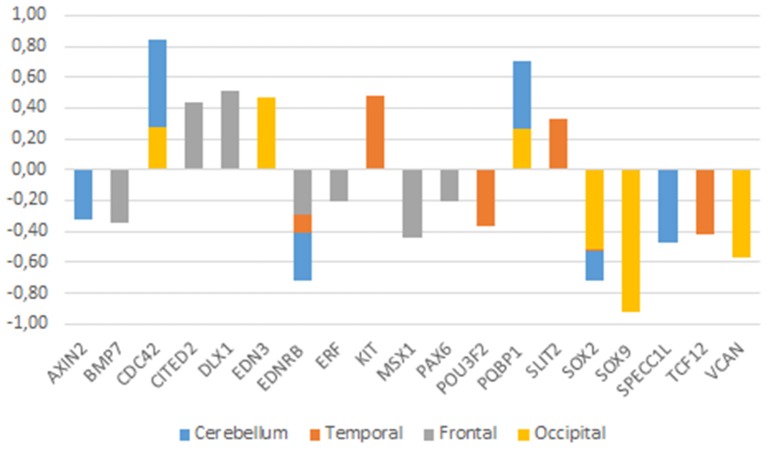
Figure 3.
Expression profiles of candidate genes in the ASD brain. Data were gathered from the following microarray expression datasets available on the Gene Expression Omnibus database (GEO datasets, http://www.ncbi.nlm.nih.gov/gds): GSE28521 (Voineagu et al., 2011) for the temporal and frontal cortices, GSE38322 (Ginsberg et al., 2012) for the cerebellum and the occipital cortex. Data are shown as log transformation of fold changes (logFC) between patients and corresponding controls. Only genes showing statistically significant (p < 0.05) differential expression were considered. Additional details may be found in the Supplemental information file.

