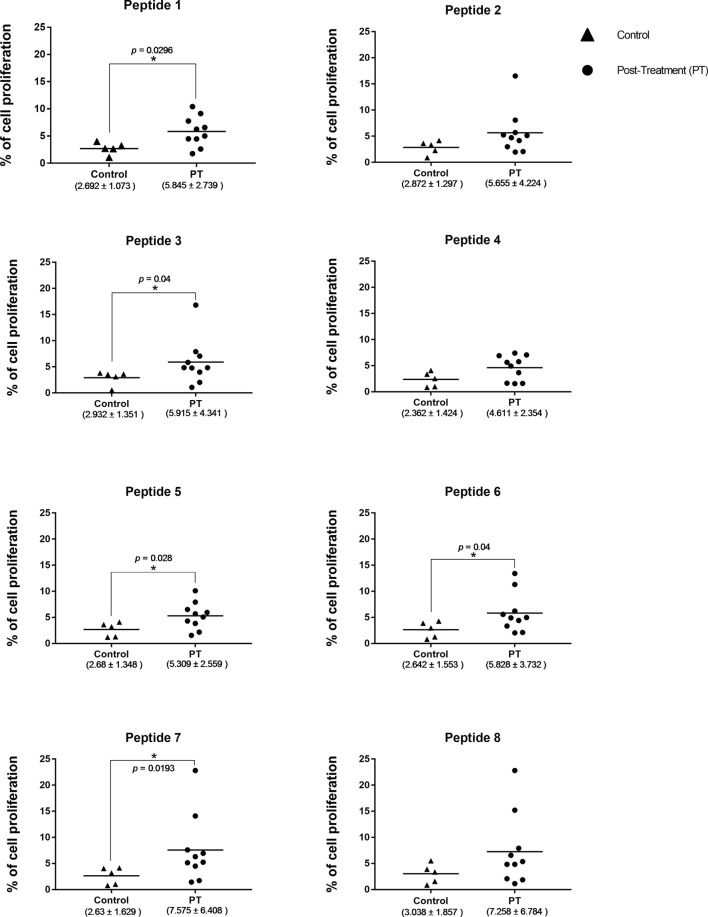
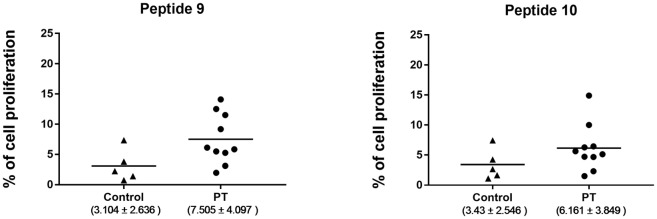
Figure 7.
Comparison of the proliferation data from PBMC derived from the cutaneous leishmaniasis post treatment (PT) patients with the PBMC proliferation data from the control group, in response to different peptides. The asterisk indicates significant differences (p < 0.05) between patients and control group. The horizontal bars represent the mean values for each group. The median percentage levels and the corresponding SD for each group tested are described below.


