
Fig. 15.
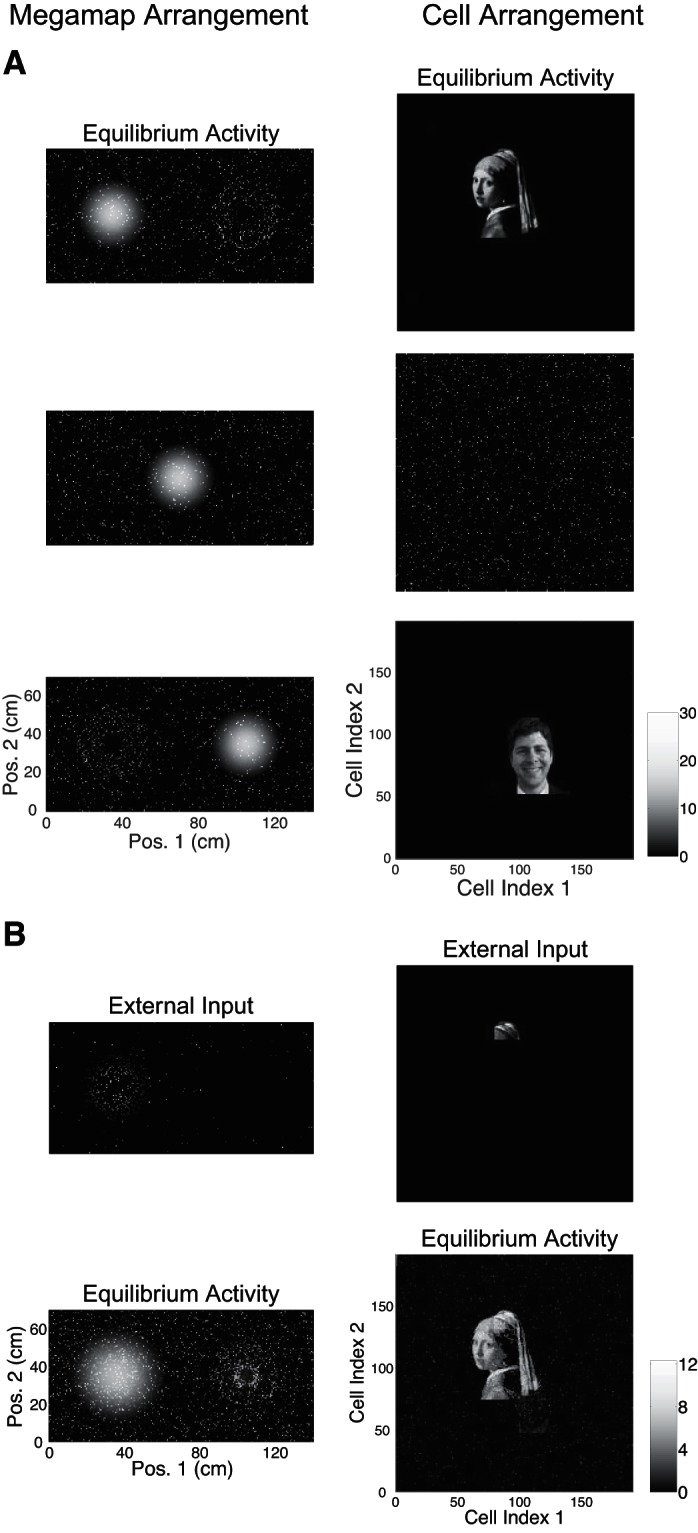
Dual interpretation of network activity patterns: example 2. A: the megamap represents a square region with 2 complex nonspatial patterns. When the animal is located at each of 3 locations, the equilibrium firing rates (Hz) are visualized in 2 ways (Fig. 13) to reveal the spatial (left) and nonspatial (right) information carried by the single network activity vector. The ghost effect in the megamap arrangement at locations corresponding to an image (top and bottom) is a result of the 16% of cells that represent both images. This overlap is much higher than the ∼6% of overlap between any other pair of activity bumps. As a result, the megamap has greater than average activity near the first image as a reflection of the robust activity bump near the second image, and vice versa. The multiplicity and randomness of the place code permit these 2 overlapping images to be embedded into the spatial framework of the megamap. B: the attractor network can perform pattern completion. Top, only cells representing the bun receive external input. Bottom, the equilibrium activity represents the complete learned pattern. The initial state is random. Supplemental Video S2 shows the 2 visualizations as the animal moves continuously across the region.