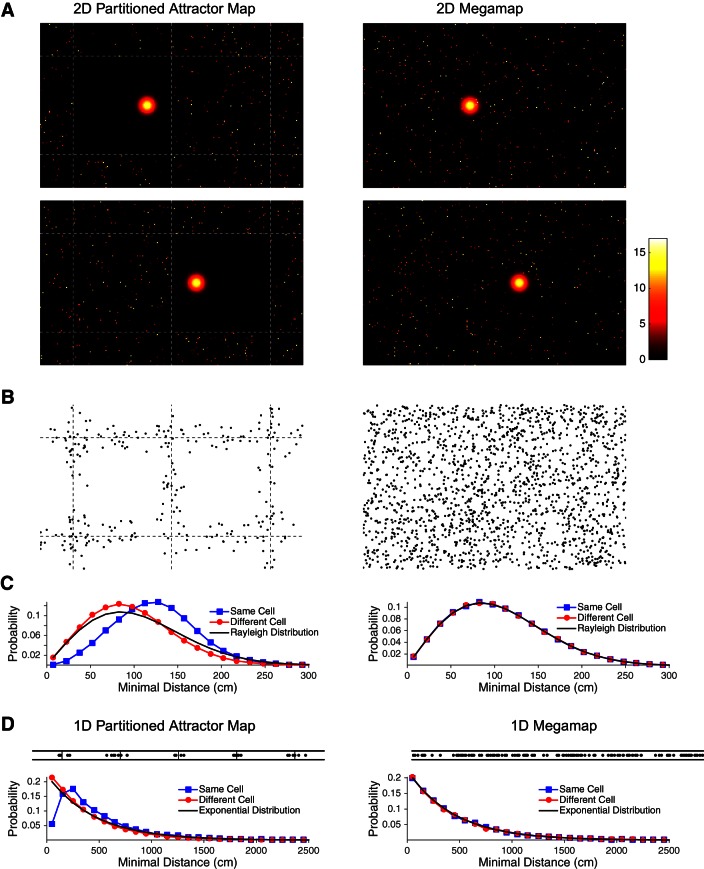
Fig. 16.
Distinguishing features of the partitioned attractor map (Fig. 1B) and the megamap (Fig. 1C). A–C: the ensemble represents a 15 × 15-m2 region (the central 16-m2 subregion is shown in A and B). Each place cell has at most 1 place field in each 1.5 × 1.5-m2 chart of the partitioned region (left), and place fields follow the Poisson distribution over the megamap (right). A: the models differ in the scattered activity surrounding the localized activity bump, where the desired activity (Eq. 9, in Hz) of each place cell is plotted redundantly at all of its place field centers for both models. A place cell participating in the activity bump is excluded from having an additional place field in the same chart of the partitioned attractor map, creating a single clean chart analogous to the active chart predicted when the single-peaked attractor model is applied to multiple environments (Samsonovich and McNaughton 1997; Samsonovich 1998). A neighboring chart becomes clean when the animal moves 60 cm to the right (bottom). In contrast, activity is scattered throughout the megamap, since a place cell representing the animal's location may have additional place fields anywhere in the region. B: place fields that are close to their nearest neighbors cluster near the artificial boundaries between subregions of the partitioned attractor map, but they are distributed evenly throughout the megamap. Each data point indicates the center of a place field that is within 30 cm of a second place field of the same cell. C: the Poisson distribution of place fields over the megamap implies that the distance to nearest neighbor follows the Rayleigh distribution (black curve; Eq. 15), whether the nearest neighbor is taken from place fields of the same cell (blue) or a single random second cell (red). The 2 distributions differ for the partitioned attractor map because of its exclusion principle. D: the ensemble represents a 100-m × 30-cm linear track, which may be approximated as a 1-dimensional environment. Top, similar to B, place fields within 50 cm of their nearest neighbor from the same cell cluster near the artificial boundaries of the partitioned attractor map but are evenly distributed throughout the megamap. Bottom, similar to C, the distribution of distances to nearest neighbor for the partitioned attractor differ whether considering the same cell or a different cell, but the distances follow the exponential distribution (Eq. 16) over the 1-dimensional megamap.

