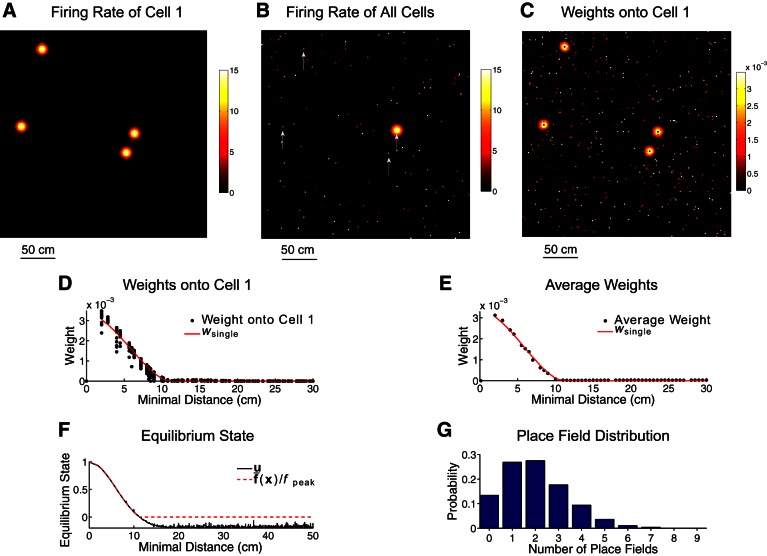
Fig. 5.
Structure of the ideal megamap. The external input is given by Eq. 8 with Ipeak = 0.3. A: any cell in the megamap may have multiple, irregularly spaced place fields, as illustrated by the firing rate (Hz) of cell 1 as the animal moves throughout the 9-m2 region. B: the megamap encodes space through a localized activity bump centered at the animal's location. The activity bump is visualized by plotting the equilibrium firing rate of each place cell redundantly at all of its place field centers. Each cell appears multiple times in the megamap, as illustrated in Fig. 1C. Scattered noise can be seen throughout the megamap, since cells like cell 1 (whose firing rate is indicated by arrows) have place fields near the animal and elsewhere in the region. C: recurrent weights onto cell 1 are visualized by plotting the weight from each presynaptic place cell redundantly at all of its place field centers. Cell 1 is driven by its 4 groups of neighbors on the megamap. D and E: the spatial profile of the recurrent weights is approximated by wsingle, the spatial profile were each cell to have a single place field (see materials and methods). The weight profile for cell 1 (D) is revealed by plotting the weight from each place cell onto cell 1 as a function of the minimal distance between the place field centers of the 2 cells. In E, this weight profile is averaged over all cells in the megamap. F: the network state vector is visualized by plotting the equilibrium state of each cell as a function of the minimal distance between its place field centers and the animal's location, x. The corresponding activity bump (B) approximates the desired activity (Eq. 9), providing a strong, stable signal for the animal's location. The subthreshold fluctuations in the state are due to the multipeaked structure of the recurrent weights. G: for the population of 11,204 place cells, 9,731 cells have at least one place field in the 9-m2 region with 2.3 ± 1.3 fields per cell.

