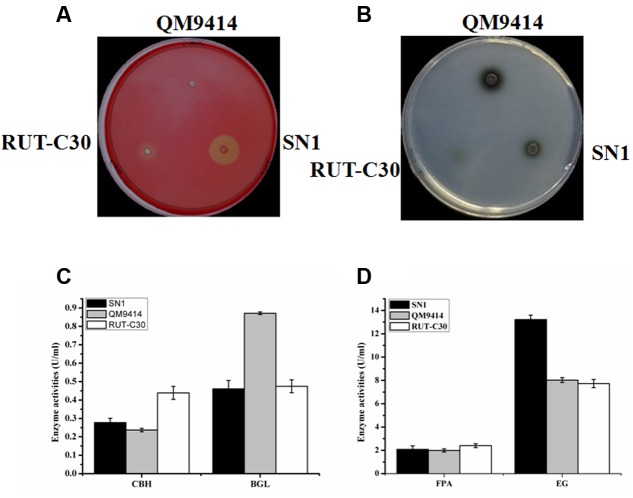
FIGURE 2.
A comparison of cellulase production in T. reesei SN1, QM9414 and RUT-C30. (A) The endoglucanase production of T. reesei SN1, QM9414 and RUT-C30 on the condition of 1% CMC-Na with 0.5% triton at 30°C for 2 days. (B) Detection of β-glucosidase activity on the CMC-esculin plate in T. reesei SN1, QM9414 and RUT-C30 at 30°C for 24 h. (C) The FPA and EG activities of the T. reesei SN1, QM9414 and RUT-C30, were measured after being induced in cellulase fermentation medium for 5 days. (D) The CBH and BGL activities of the T. reesei SN1, QM9414 and RUT-C30, were measured as the above mentioned. All results are represented as the mean of three independent experiments; error bars express the standard deviation.

