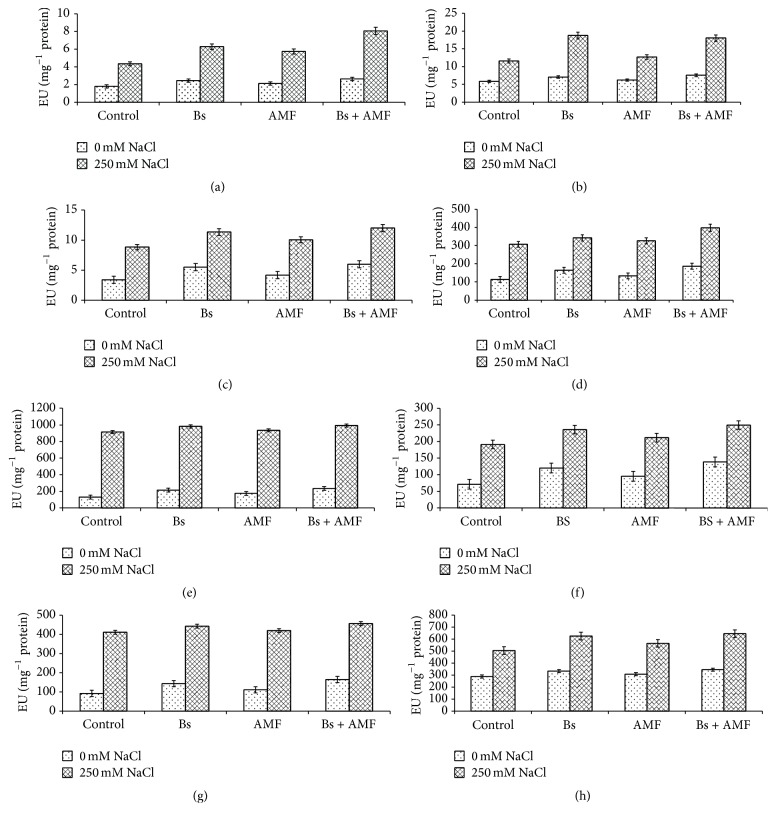
Figure 4.
Effect of salinity stress (250 mM NaCl) on (a) superoxide dismutase [SOD, EC 1.15.1.1] (LSD at 0.05 : 0.069; coefficient of variance: 1.910); (b) catalase [CAT, EC 1.11.1.6] (LSD at 0.05 : 0.173; coefficient of variance: 1.830); (c) peroxidase [POD, EC 1.11.1.7] (LSD at 0.05 : 0.238; coefficient of variance: 3.597); (d) glutathione reductase [GR, EC 1.6.4.2 (nmol/min/g FW)] (LSD at 0.05 : 4.056; coefficient of variance: 1.903); (e) ascorbate peroxidase [APX, EC 1.11.1.11, nmol/min/g FW] (LSD at 0.05 : 6.907; coefficient of variance: 1.394); (f) dehydroascorbate reductase (DHAR, EC: 1.8.5.1, nmol/g FW) (LSD at 0.05 : 2.492; coefficient of variance: 1.751); (g) monodehydroascorbate reductase [MDHAR, EC 1.6.5.4, nmol/min/g FW] (LSD at 0.05 : 4.374; coefficient of variance: 1.805); and (h) nitrosoglutathione reductase [GSNOR, EC 1.1.1.284, nmol/g FW] (LSD at 0.05 : 4.335; coefficient of variance: 1.108) in Acacia gerrardii with and without AMF and Bacillus subtilis (Bs).

