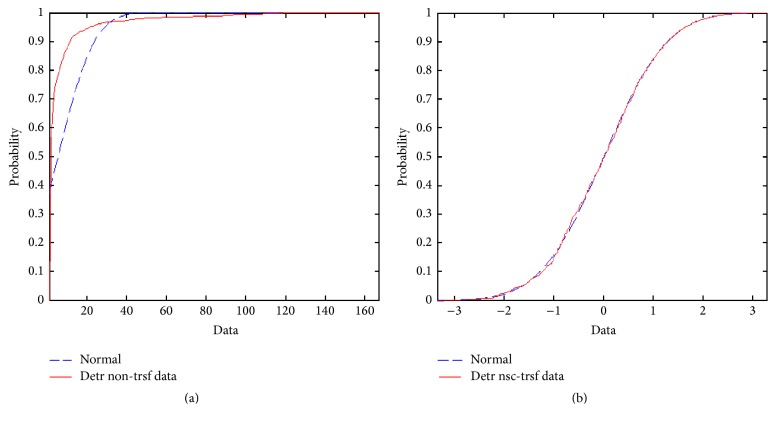
Figure 4.
SARS data transformation. (a) Comparison of the SARS raw dataset cumulative density function (CDF) and the corresponding one of the normal distribution. The maximum observed deviation between those two CDF is about 28.88% at data value 5. (b) N-score transformed CDF of the SARS study data and the normal distribution. The maximum observed deviation between those two CDF has dropped down, compared to panel (a), to about 2.26% at data value −0.63853.

