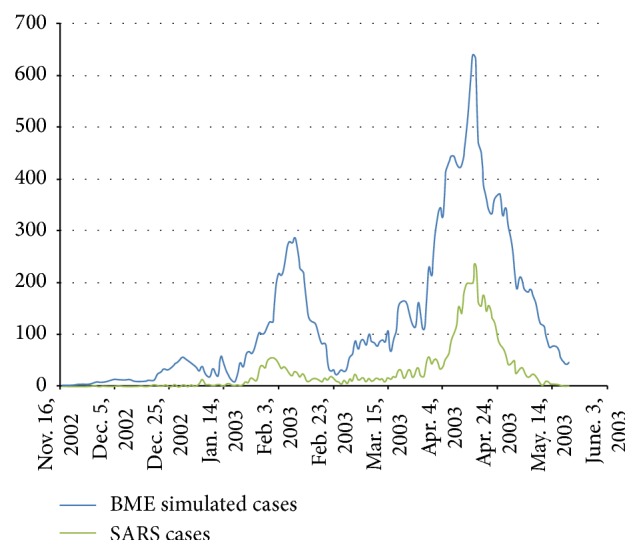
Figure 6.

Contrast between observed SARS outbreak number and BME estimation number. The green line represents actual SARS infections on a daily basis from November 16, 2002, to May 20, 2003. The blue line represents the corresponding daily number of cases according to the BME estimates. BME reflects relatively accurately the temporal pattern in the daily number of infections, although it overestimates systematically the number values.
