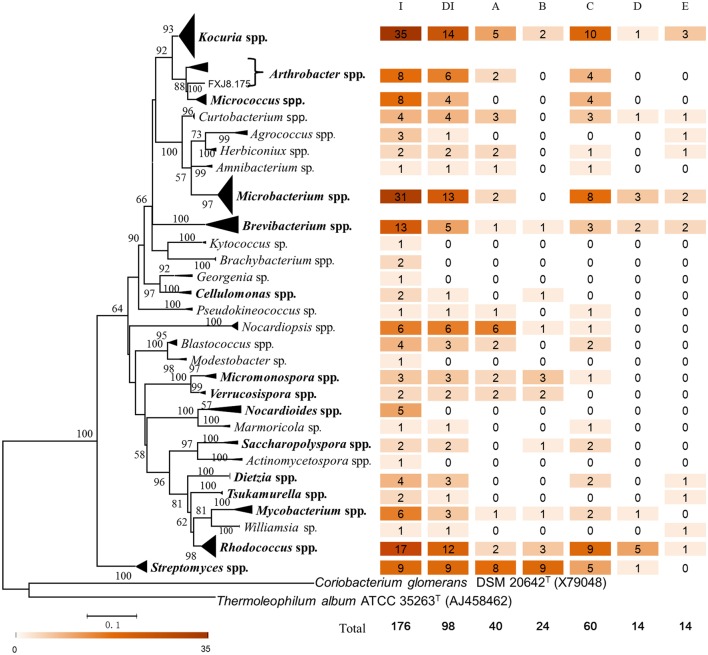
Figure 6.
Phylogenetic diversity, taxonomic affiliation and degradation capacity of culturable actinobacterial isolates. The maximum-likelihood tree was based on nearly full-length 16S rRNA gene sequences of the isolates and closely related type strains. The GTR+G+I evolutionary model was selected to construct the tree. Coriobacterium glomerans DSM 20642T and Thermoleophilum album ATCC 35263T were set as outgroups. Numbers at branch nodes are percentages of bootstrap replicates of 1000 resamplings (only values above 50% are shown). The bar represents 0.1 substitutions per nucleotide position. Genera that were also recovered in the pyrosequencing data set are in bold. Numbers following each genus indicate the number of isolates or degrading isolates. I, number of isolates; DI, number of degrading isolates; A, number of cellulose-degrading isolates; B, number of chitin-degrading isolates; C, number of pectin-degrading isolates; D, number of fluoranthene-degrading isolates; E, number of phenanthrene-degrading isolates.

