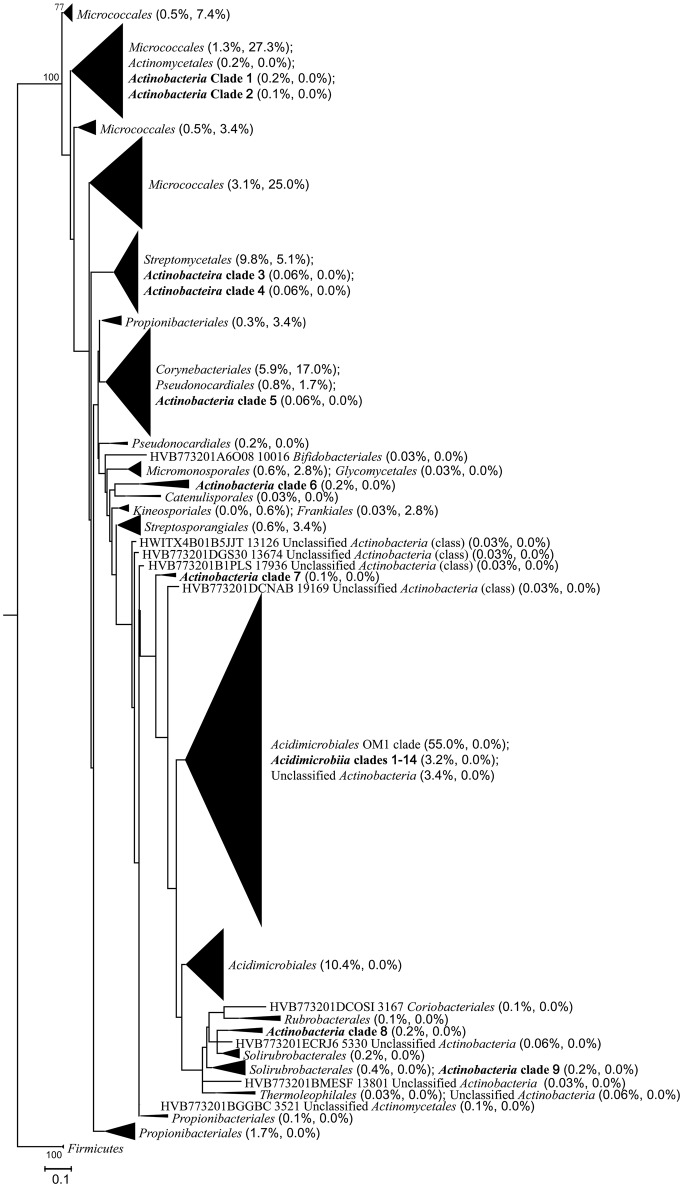
Figure 7.
Maximum-likelihood phylogenetic tree based on partial 16S rRNA gene sequences illustrating the relationships among all the isolates and representative actinobacterial sequences from the pyrosequencing data set. The tree was constructed using the GRT+G+I model. Firmicutes was set as the outgroup. Taxonomic assignments of the sequences were based on both the RDP and SILVA databases. The tree is displayed at order level. Numbers at branch nodes are percentages of bootstrap replicates of 100 resamplings (only values above 50% are shown). Numbers in the parentheses following each order or clade indicate the relative abundance of pyrosequencing reads and isolates, respectively. The bar represents 0.1 substitutions per nucleotide position.

