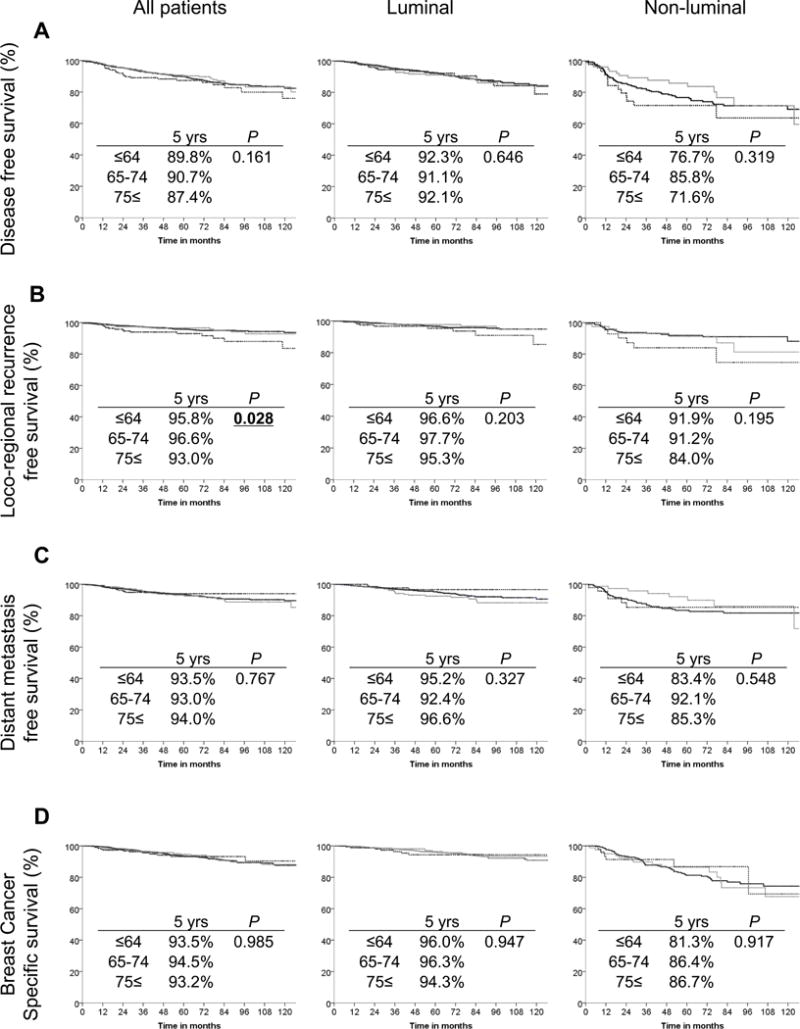
Fig. 1.

Prognostic analysis by age group. A: Disease-free survival curve. B: Loco-regional recurrence free survival curve. C: Distant metastasis free survival curve. D: Breast cancer specific survival curve. Black lines represent the patients below 64 years old, gray lines represent the patients between 65 and 74 years old, and the black dotted line represent the patients over 75 years old.
