
Figure 3.
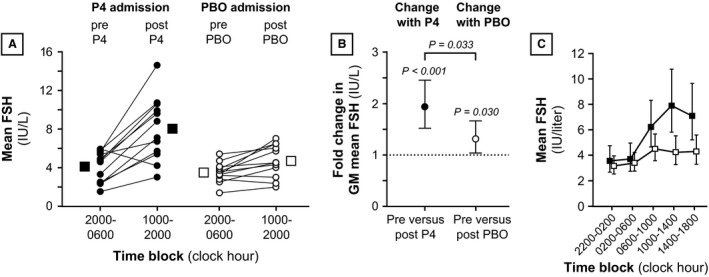
Mean follicle‐stimulating hormone (FSH) during progesterone and placebo admissions. Panel A: Data for 10‐h time blocks immediately before intervention (2000–0600) versus 10‐h time blocks after intervention (1000–2000). Panel B: Pre versus postintervention changes (i.e., 2000–0600 vs. 1000–2000). Panel C: Data for two 4‐h time blocks before intervention and three 4‐h time blocks after intervention. All data are organized as in Figure 2. P4, progesterone; PBO, placebo.