
Figure 4.
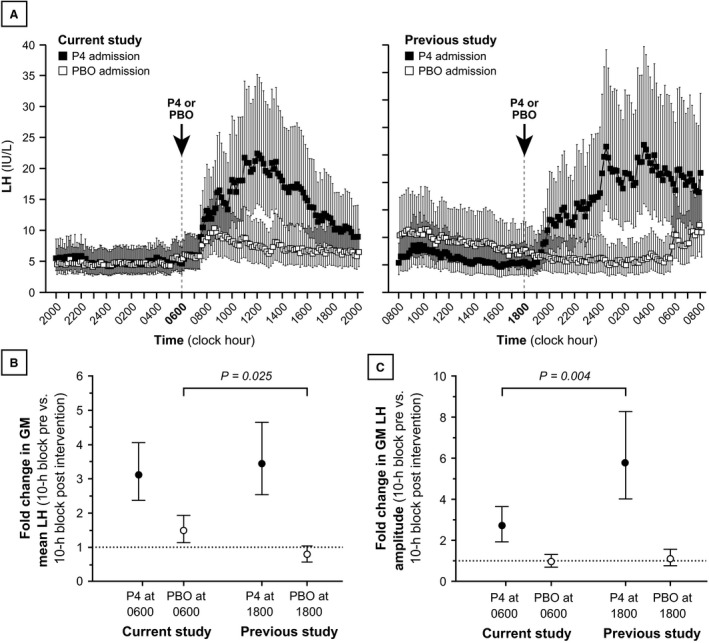
Mean luteinizing hormone (LH) and LH pulse amplitude during progesterone and placebo admissions for the current study and for our previous study (McCartney et al. 2007a). Panel A: LH concentrations (measured every 10 min) for the current study (left) and the previous study (right). Progesterone and placebo admissions are denoted by solid and open data points, respectively. Each data point identifies the geometric mean (GM), and vertical lines identify 95% confidence intervals for the GM. Panels B and C: Fold changes in mean LH (B) and LH pulse amplitude (C), pre versus postintervention. The specific changes shown are as follows: 2000–0600 versus 1000–2000 when progesterone or placebo was administered at 0600; and 0800–1800 versus 2200–0800 when progesterone or placebo was administered at 1800. The points identify the fold change in the GM, and the vertical lines identify the 95% confidence interval for the fold change. P values (Bonferroni‐corrected) relate to between‐study comparisons of pre versus postintervention changes, ostensibly reflecting clock hour differences (e.g., pre vs. postintervention change when progesterone was given at 0600 vs. pre vs. postintervention change when progesterone was given at 1800). P4, progesterone; PBO, placebo.