
Figure 4.
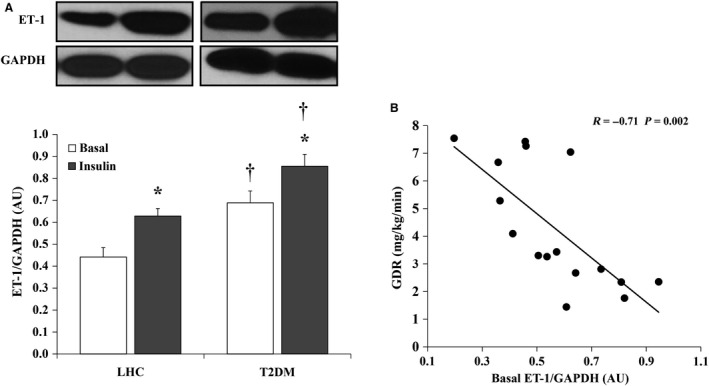
Hyperinsulinemia induces ET‐1 protein expression in skeletal muscle of lean healthy controls (LHCs) (n = 8) and T2DM (n = 8). (A) Western blot analysis of ET‐1 protein expression in skeletal muscle homogenate. Signal relative intensity was normalized to GAPDH and results represent the means ± SE for each group. *P < 0.05 for insulin versus basal and † (P < 0.05) for LHCs versus T2DM. (B) Correlation between ET‐1 protein expression and clamp‐derived glucose disposal rate in the study subjects (n = 16).