Figure 2.
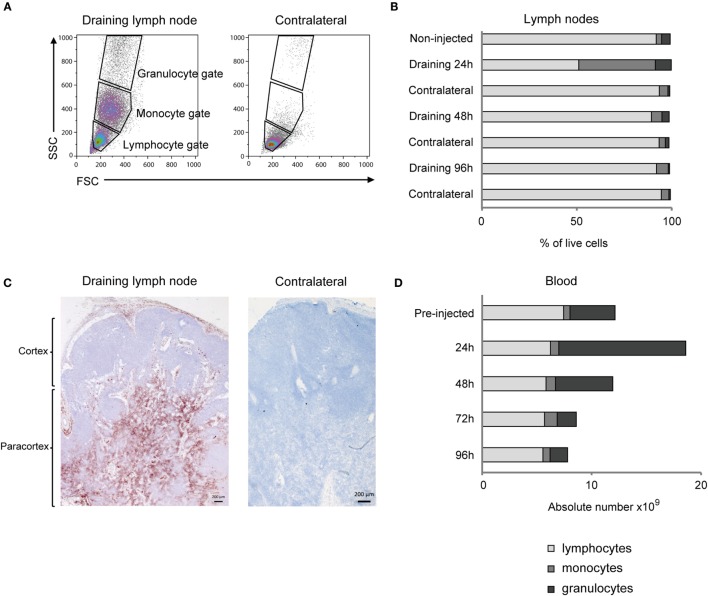
Cellular recruitment to lymph nodes (LN) and peripheral blood. (A) LN cells were prepared for FCM analysis and gated on forward/side scatter (FSC/SSC) characteristics. Plots from one representative animal are presented. Panels illustrate the gating of lymphocytes, monocytes, and granulocytes as indicated and in the draining LN (left) and the contralateral LN (right), at 24 h post-injection. (B) Percentages of major immune cell populations in LNs, based on the gating strategy in A. Horizontal stacked bars show mean percentages of lymphocytes (gray), monocytes (dark gray), and granulocytes (black) of the total live cell population in non-injected animals (n = 6) and at different time points after adjuvant injection (n = 2–3). (C) IHC labeling of draining and contralateral LNs at 24 h post-injection with antibody against CD14. Different regions of the LN are indicated. (D) Cellular differential counts in peripheral blood. Horizontal stacked bars show mean absolute numbers (×109) of lymphocytes (gray), monocytes (dark gray), and granulocytes (black) at pre-injection and at different time points after adjuvant injection.

