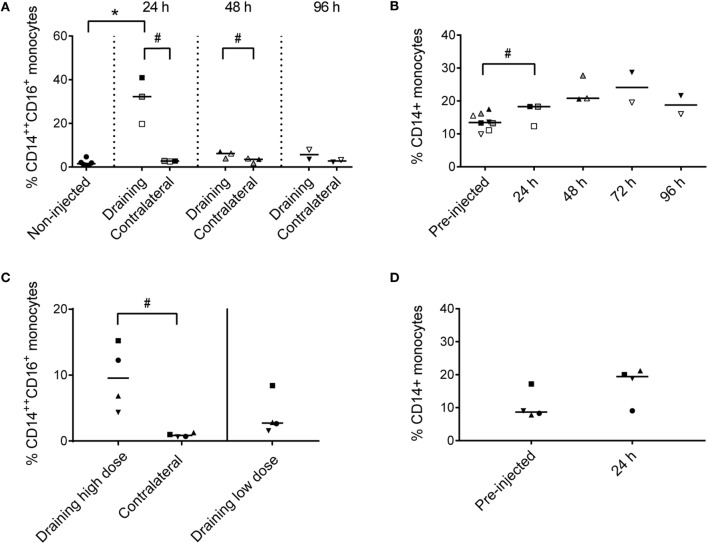
Figure 4.
Percentages of monocytes in LNs and PBMC. (A) Percentages of CD14++ CD16+ monocytes of total live cells in LNs of non-injected animals, and in draining and contralateral LNs of injected animals at 24, 48, and 96 h post-injection. Symbols represent individual animals and the median value within each group is depicted as a line. Statistical significant differences between injected and non-injected groups using the Wilcoxon rank-sum test are indicated as *P < 0.05. Statistical significant differences between groups consisting of the same individuals (identical symbols) using the paired t-test are indicated as #P < 0.05. (B) Percentage of CD14+ monocytes of live cells in PBMC at pre-injection, and at 24, 48, 72, and 96 h post-injection. Symbols and statistics as in (A) (#P < 0.05). (C) Percentage of CD14++ CD16+ monocytes of live cells in the draining high dose (subiliac) LN and the contralateral LN, and in the draining low-dose (superficial cervical) LN. Symbols and statistics as in A (#P < 0.05). (D) Percentage of CD14+ monocytes of total live cells in PBMC at pre-injection and after 24 h. Symbols and statistics as in A.

