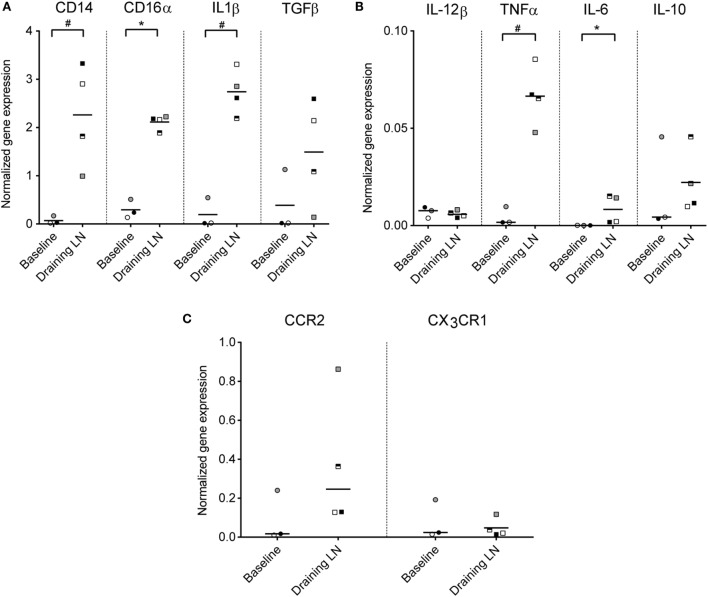
Figure 7.
Gene expression of monocytes from the draining LN. Gene expression levels (normalized to the reference gene PPIA) of CD14+ cells isolated from blood (baseline non-injected) and from the draining LN at 24 h post-injection, as analyzed by RT-qPCR. Symbols represent individual animals and the median value within each group is depicted as a line. Statistical significant differences between the two groups using the unpaired t-test (for normally distributed data) are indicated as #P ≤ 0.05, and the Wilcoxon rank-sum test (for non-normally distributed data) are indicated as *P ≤ 0.05. (A) Gene expression levels of CD14, CD16α, IL-1β, and TGFβ. (B) Gene expression levels of IL-12β, TNFα, IL-6, and IL-10. Note the difference in y-axis range from (A). (C) Gene expression levels of chemokine receptors CCR2 and CX3CR1. Note the difference in y-axis range from (A,B).

