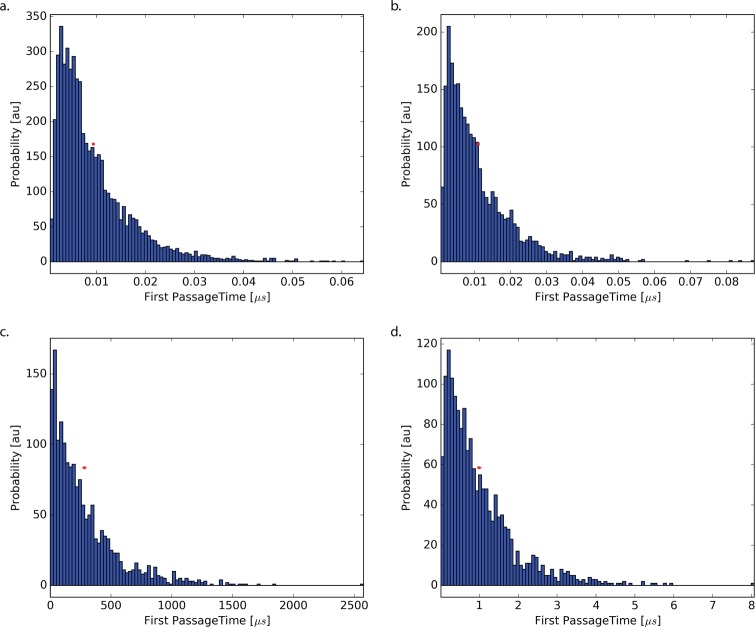
Figure 4.
Shown here are the distributions of the brute force MFPTs for systems (a) flat, (b) small-barrier, (c) urea, and (d) codeine. Because of presence of large barriers in the urea and codeine cases, the sampling is limited. The red points and error bars indicate the mean and boostrapped 95% confidence intervals of the MFPT.

