Figure 1.
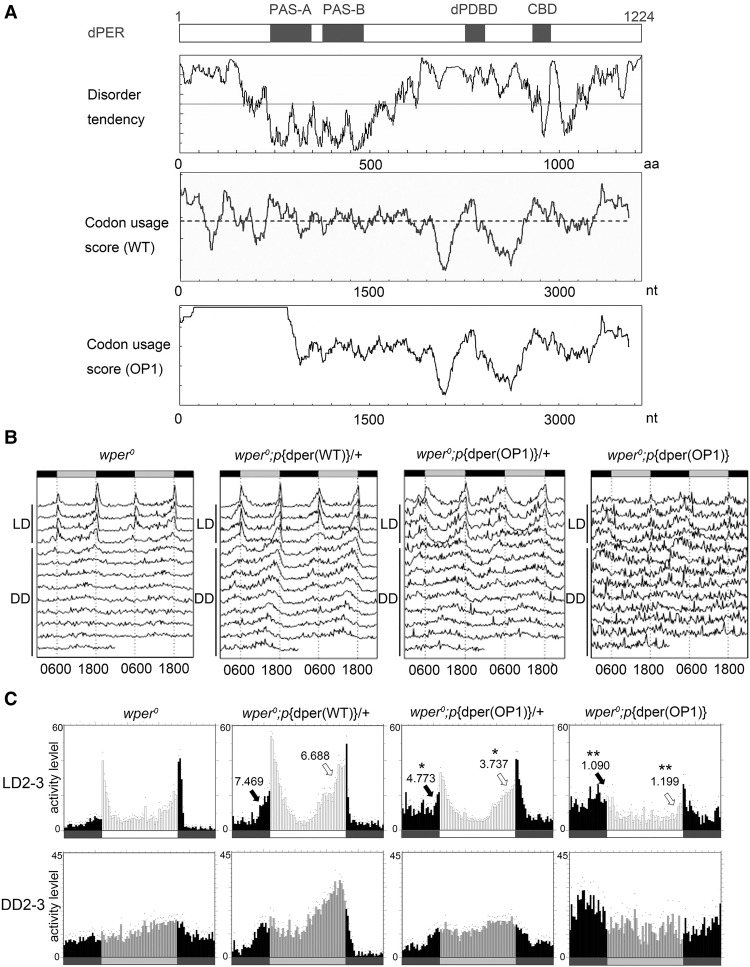
Codon optimization of the N-terminal part of dper led to impaired circadian locomotor activity rhythms. (A, from top to bottom) A diagram depicting the previously identified domains of dPER. PAS-A and PAS-B (PAS domains); (dPDBD) DBT-binding domain; (CBD) dCLK-binding domain. Disorder tendency plot of the dPER protein using IUPred. Codon usage score plot (CAI value, window 35) of wild-type dper. Codon usage score plot (CAI value, window 35) of dper(OP1). The dashed line in the codon usage for the wild-type gene indicates the average CAI of wild-type dper. (B) Double plot actograms showing locomotor activity rhythms of the wper0; p{dper(WT)} and wper0;p{dper(OP1)} fly strains in 4 d of light/dark cycles (LD) and 7 d of constant darkness (DD). (C) Eduction graphs generated from locomotor activity analysis showing the rhythms of the indicated strains. The Y-axis represents activity levels. (Top) The activity data generated by averaging the second and third days in light/dark cycles (LD 2–3). (Bottom) The activity data generated by averaging the second and third days in DD (DD 2–3). Arrows indicate morning anticipation (black) and evening anticipation (white) behaviors with their respective anticipation index (AI) values. The statistical analysis was performed using a two-tailed t- test to compare the AIs between the OP1 mutants and the wild-type per gene rescue strain. (*) P-value < 0.05; (**) P-value < 0.01.

