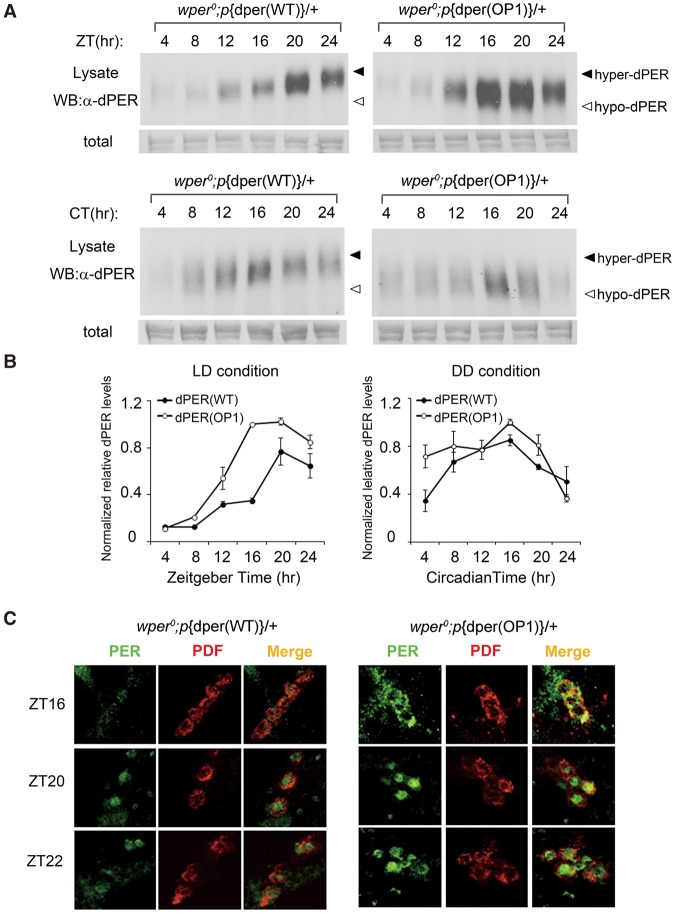
Figure 2.
Impaired dPER rhythms in OP1 flies. (A) Western blot results showing the dPER molecular rhythm in LD (top) and DD (bottom) for wild-type and OP1 flies. The filled and open arrowheads indicate the hyperphosphorylated and hypophosphorylated dPER proteins, respectively. Membrane staining was used as a loading control. (B) Densitometric analyses of the results from three independent experiments. The levels of dPER were normalized to the loading control. Error bars indicate ±SD. (C) Immunohistochemistry assay of dPER expression in pigment dispersing factor (PDF)-positive (PDF+) circadian neurons in fly brains. Adult flies were entrained to LD cycle, and brains were dissected for immunohistochemistry analysis at the indicated time points.

