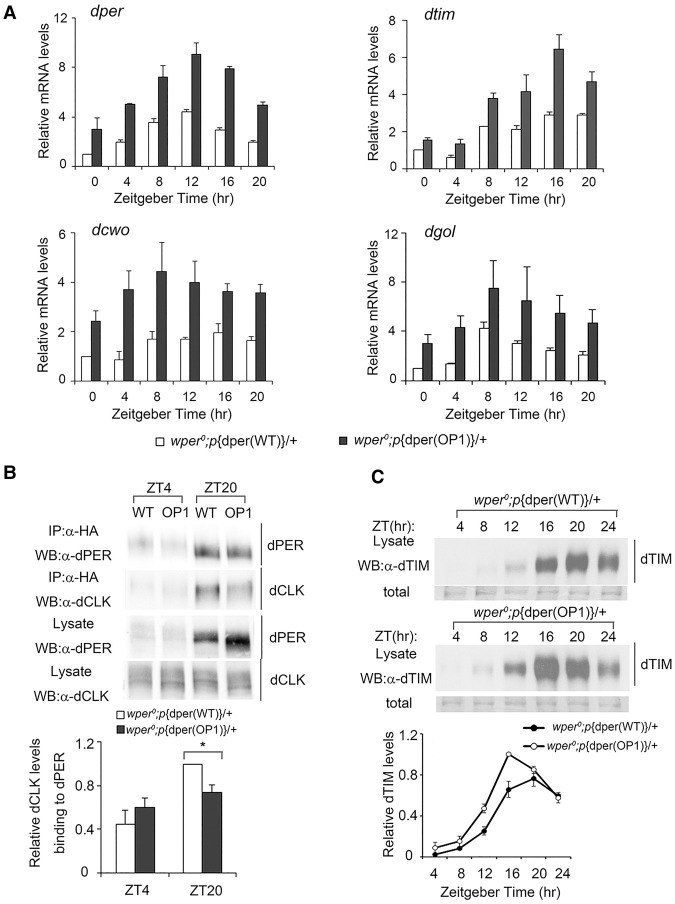
Figure 3.
Impaired circadian negative feedback loop in OP1 flies. (A) Quantitative RT–PCR assays showing the mRNA levels of dper, dtim, dcwo, and dgol. Error bars indicate SD. (B) Immunoprecipitation assay showing the reduced interaction between dPER and CLK in the wper0;p{dper(OP1)} flies. Head extracts were prepared from wper0; p{dper(WT)} and wper0;p{dper(OP1)} flies collected at the indicated times (ZT). (Top) Representative Western blot results are shown. (Bottom) Densitometric analyses from four independent biological experiments. The amount of dCLK was normalized to the HA (dPER) signal in the immunoprecipitation. (C) Western blot analysis showing the protein levels of TIM in the indicated fly strains in LD. Membrane staining was used as a loading control. (Bottom) Densitometric analyses of the Western blot results. Error bars indicate ±SD.

