Figure 7.
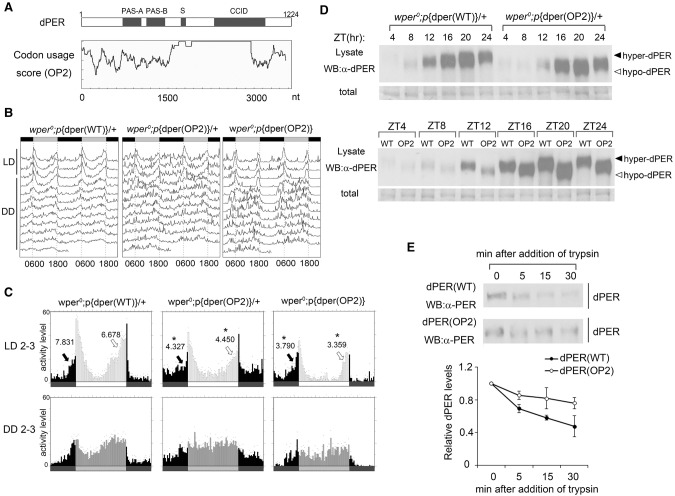
Codon optimization of the central part of dper resulted in impaired circadian rhythms and altered dPER structure. (A) Diagrams showing the dPER protein domains and the codon usage score plot of dper (CAI value, window 35) after codon optimization. (B) Double plot actogram showing the circadian rhythms of wper0;p{dper(WT)} and wper0;p{dper(OP2)} strains after 4 d of LD and 7 d of DD. (C) Eduction graphs generated from locomotor activity analysis showing the circadian rhythms of the indicated strains in LD 2–3 (top) and in DD 2–3 (bottom). Arrows indicate morning anticipation (black) and evening anticipation (white) behaviors with their respective AI values. (*) P < 0.05. (D, top panels) Western blot results using dPER antibody showing the dPER rhythm in LD. (Bottom panels) Side-by-side Western blot analysis results showing the dPER mobility differences between two fly strains. Membrane staining was used as a loading control. (E, top panels) Western blots comparing the sensitivity of dPER from the indicated strains with partial trypsin (0.5 µg/mL) digestion. (Bottom panels) Densitometric analyses of the Western blot results from three independent experiments. The levels of dPER at time point 0 were set as 1. Error bars indicate ±SD.

